How do wavelet filters compare to simple filters, like windowed mean and windowed median?
The window filters operate by moving the window over the array, from the start to the end. The mean filter takes the average across the window and sets the element in the middle of the window to this average. Then the window is advanced one step and the mean (average) is calculated again.
The median is the middle of a sorted list of numbers. For example, the median of 1 3 5 8 15 is 5. In contrast, the mean (a.k.a. average) is 6.4. The median does not move as much in response to a single large element. If the window size is even, the median is the average of the middle two elements. So, for example, the median of 2 6 13 16 is 9.5 (9.5 = (6 + 13)/2).
As in the case with the mean filter, the window for the median filter is moved over the array from the start to the end. The list is initially sorted and the median number is found. The middle element in the window is set to the median. The window is moved and a number is added to the ordered list and the median is chosen again and the element following the one previously changes is set to the median.
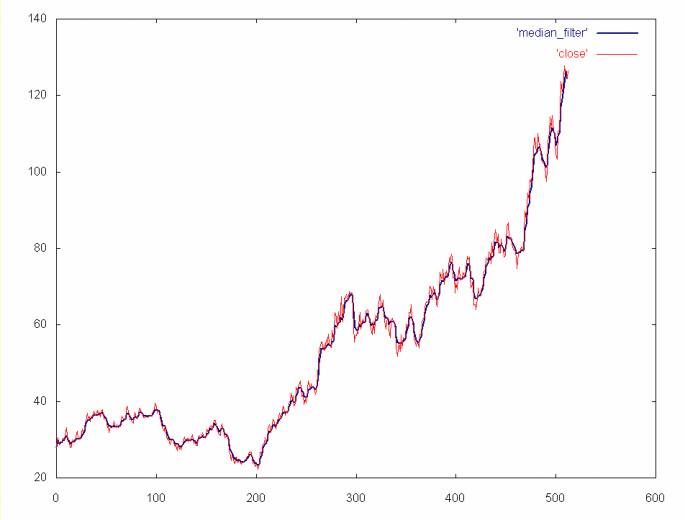
For a window size of four and the AMAT time series, the windowed mean and windowed median filters produce virtually the same result. So only the windowed median is shown below.
A windowed median filter with a window size of four. The filtered data is shown in blue, the unfiltered close price is in red.
Note that the mean and median filters lose a more detail than the wavelet filters. To the extent that this detail might be of interest, these filters are not as powerful as the wavelet filters. By the same argument, these windowed filters are probably better than a cubic spline, since they preserve more detail. The AMAT time series, with the high frequence spectrum removed is shown below for comparision.
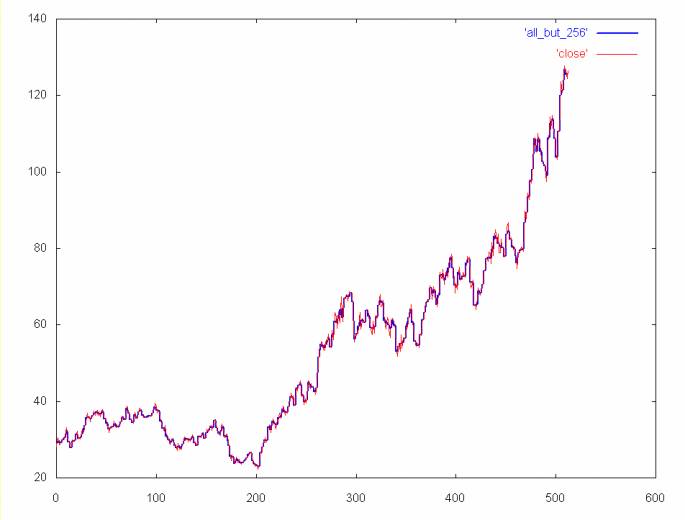
AMAT close price time series (in blue) without the high frequency spectrum (e.g., the time series was regenerated from coefficient spectrums 1, 2, 4, 8, 16, 32, 64, and 128). As with the median filter plot, the unfiltered close price is shown in red.
Ian Kaplan, July 2001
Revised:
back to Applying the Haar Wavelet Transform to Time Series Information
