The Wharton Research Data Service (WRDS) data set and Factor Model Factors
Information wants to be free
Attributed to Stewart Brand
On the one hand information wants to be expensive, because it's so
valuable. The right information in the right place just changes your
life.
Steve Wozniak, co-founder of Apple Computer
Table of Contents
Introduction
This page started out as a set of notes that I wrote while I was
working with the Wharton Research Data Service (WRDS) data set for my Masters
presentation in Computational Finance and Risk Management Masters at
the University of Washington, on November 22, 2013.
I am grateful that I had access to the WRDS databases. Without this
access I would not have been able to do my Masters presentation work. This is a
fantastic resource for graduate students and researchers.
Locating the data that I needed within the WRDS data bases and
cleaning up the data so that it could be used in my Masters
presentation proved
to be extremely time consuming. At one point I worried that I would
end up giving my Masters presentation on data preparation since this
work had consumed so much time. I hope that these notes will help
others navigate the WRDS data (and spend less time on the data and
more on their research).
Pension funds, endowments, hedge funds and other investment groups
spend tens of thousands, or hundreds of thousands of dollars a year on
market data. Some of these "industry" data sources are available
through the Wharton Research Data Service. I don't know if there are
differences in the quality of the academic databases vs. those
provided to industrial subscribers.
Apparently different academic subscribers have
different levels of access. So these notes are not comprehensive: a
subscription may have more or less data access than is noted here.
Some of these data sources, like the Fama French data may be available
elsewhere (e.g., Kenneth
French's web site).
I have focused on data sets that are useful for building
portfolio factor models based on corporate balance sheet data
(earnings per share, etc...). To explore the WRDS data, I first used the S&P
100 stocks and then later, the S&P 500 stocks. Most of the detail
here involves stocks in the CRSP/Compustat S&P 500 index, from 1998 to
2013.
The WRDS data can be difficult to navigate. Each data set has a
variety of sub-data sets. Even after reading the documentation it can
be difficult to understand what is contained in the data set or how complete
it is. These notes reflect many hours spent exploring the WRDS data set.
In most cases the descriptions of the data sets consist of edited
versions of the description provided on the WRDS web site.
-
AuditAnalytics
Audit Analytics provides detailed research on over 150,000 active
audits and more than 10,000 accounting firms.
Audit and Compliance datasets covers all SEC registrants. Audit
Analytics data includes the tracking and analysis of public company
disclosures related to the audit, compliance, governance, corporate
actions and federal litigation.
-
Bank Regulatory
This database contains five databases for regulated depository financial
institutions. These databases provide accounting data for bank holding
companies, commercial banks, savings banks, and savings and loans
institutions. The source of the data comes from the required
regulatory forms filed for supervising purposes. Please see the
Federal Reserve Bank of Chicago website for more information.
-
Blockholders
This dataset contains standardized data for blockholders of 1,913
companies. The data was cleaned from biases and mistakes usually
observed in the standard source for this particular type of
data. Blockholders' data is reported by firm for the period 1996-2001.
-
Bureau van Dijk
Bureau van Dijk (BvD) is widely recognized as a specialist provider of
both public and private company information within the academic
community.
WRDS currently offers users with the following company information
databases through BvD's Orbis product:
-
Amadeus: European public and private company information
-
Bankscope: Global banking information
-
Osiris: Globally listed, as well as major unlisted or delisted
companies
-
CBOE Indexes (various versions of the VIX index)
The CBOE (Chicago Board Options Exchange) Volatility Index is a key
measure of market expectations of near-term volatility conveyed by S&P
500 stock index option prices. The Vix Index was introduced in 1993 by
Professor Robert E. Whaley of Duke University in his paper
Derivatives on Market Volatility: Hedging Tools Long Overdue
Journal of Derivatives 1 (Fall 1993), pp. 71-84. Since then, VIX has
been considered by many to be the world's premier barometer of
investor sentiment and market volatility.
The New VIX still measures the market's expectation of 30-day
volatility, but in a way that conforms to the latest thinking and
research among industry practitioners. The New VIX is based on S&P 500
index option prices and incorporates information from the volatility
"skew" by using a wider range of strike prices rather than just
at-the-money series.
-
Compustat from Standard and Poors
This database includes:
-
North America
This is a database of U.S. and Canadian fundamental and market information on
active and inactive publicly held companies. It provides more than 300
annual and 100 quarterly Income Statement, Balance Sheet, Statement of
Cash Flows, and supplemental data items.
-
Global
This is a database of non-U.S. and non-Canadian
fundamental and market information on more than 33,900 active and
inactive publicly held companies with annual data history from 1987.
-
Bank
-
Historical Segments
-
Snapshot
-
Capital IQ
Compustat has a wide variety of data, so it is difficult to
characterize. Compustat includes daily and monthly security
prices.
For those building factor models, Compustat has a data section labeled
Simplified Finance Statement Extract that includes monthly corporate
factors. The data appears to have fewer missing values than the IBES
data. Also, unlike IBES, the Compustat data is returned in columnar
format (factors per month, with the factors as the columns) so
software is not necessary to assemble a table of factors. However,
when I queried for the S&P 100 stocks, values for only a few stocks
where returned.
Compustat also includes the components of various
indices (e.g., computer software, chemicals, etc). It also includes
index prices. It should be possible to construct beta values for the
various indices from this data.
-
CRSP
Perhaps the most famous research database. The Center for Research in
Security Prices (CRSP) maintains the most comprehensive collection of
security price, return, and volume data for the NYSE, AMEX and NASDAQ
stock markets. Additional CRSP files provide stock indices, beta- and
cap-based portfolios, treasury bond and risk-free rates, mutual funds,
and real estate data.
-
CUSIP
The CUSIP Master Files provide CUSIP numbers, standardized
descriptions and additional data attributes for over 5 million
corporate, municipal and government securities offered in North
America.
-
DMEF Academic Data (Direct Marketing Educational Foundation) Not of
much interest to quants.
-
Dow Jones
The Dow Jones Averages are comprised of The Daily and Monthly Dow
Jones Composite (DJA), as well as The Dow Jones Industrial (DJI), The
Dow Jones Transportation (DJT), The Dow Jones Utility (DJU), The Dow
10, and The Dow 5.
-
FDIC
The Federal Deposit Insurance Corporation (FDIC) datasets contains
historical financial data for all entities filing the Report of
Condition and Income (Call Report) and some savings institutions
filing the OTS Thrift Financial Report (TFR). These entities include
commercial banks, savings banks, or savings and loans.
-
Fama French & Liquidity Factors
The Fama-French Portfolios are constructed from the intersections of
two portfolios formed on size, as measured by market equity (ME), and
three portfolios using the ratio of book equity to market equity
(BE/ME) as a proxy for value. Returns from these portfolios are used
to construct the Fama-French factors.
-
Federal Reserve Bank
-
GovPX - Tick-by-tick data after 2009.
Data must be searched by CUSIP. It's not clear from the WRDS
description how large an asset universe is covered or even what the
assets are.
-
I/B/E/S
I/B/E/S (IBES) International Inc. created their Academic Research Program
over 30 years ago to provide both summary and individual analyst
forecasts of company earnings, cash flows, and other important
financial items, as well as buy-sell-hold recommendations.
The IBES values are returned with one value (Cash Flow per Share -
CPS) on a line. Building a table from this data can be a challenge and
I wrote some Java code to do this.
-
ISSM (The Institute for the Study of Security Markets)
The Institute for the Study of Security Markets (ISSM) database
contains tick-by-tick data covering the NYSE and AMEX between 1983 and
1992, and NASDAQ between 1987 and 1992. Each year of data is divided
into two files, one for trades and one for quotes.
-
Markit Trial (credit default swap database)
-
PHLX (Philadelphia Stock Exchange)
Currency and implied volatility option database.
-
Penn World Tables (national (country) income data)
-
Risk Metrics
RiskMetrics (through ISS Governance Services) is a leader in corporate
governance data. RiskMetrics delivers to data for the new methodology to WRDS in four
datasets identified as:
-
RiskMetrics Group Historical Governance
-
Historical Directors data
-
Voting Results data
-
Shareholder Proposal data
-
SEC Order Execution
On November 15, 2000, the SEC adopted new rules aimed at improving
public disclosure of order execution and routing practices. As a
result of Rule 11Ac1-5, market centers that trade national market
system securities must make monthly, electronic disclosures of basic
information concerning their quality of executions on a stock-by-stock
basis, including how market orders of various sizes are executed
relative to the public quotes and information about effective spreads
- the spreads actually paid by investors whose orders are routed to a
particular market center. In addition, market centers must disclose
the extent to which they provide executions at prices better than the
public quotes to investors using limit orders.
Data is available on WRDS through 2005, and is no longer updated.
-
TAQ (Trade And Quote database)
The Trade and Quote (TAQ) database contains intraday transactions data
(trades and quotes) for all securities listed on the New York Stock
Exchange (NYSE) and American Stock Exchange (AMEX), as well as Nasdaq
National Market System (NMS) and SmallCap issues.
The Reg SHO - NYSE Short Sales database contains data related to SEC
Regulation SHO per the terms of the SRO requirement to make Short Sale
transactions data available on a monthly basis for trade dates
beginning January 2005 through the pilot period ending April
2006. (SROs are self-regulatory organizations in the securities
industry, such as the NYSE, that create and enforce rules for its
members based on the federal securities laws.)
-
TRACE (OTC Corporate Bond and Agency Debt Bond Transaction Data)
-
Thomson Reuters
Mutual fund holdings, institutional holdings, insider data, stock
ownership summary.
-
Zacks Trial
Analysts forecast database (e.g., Earnings per Share consensus,
surprise, etc). The trial dataset is limited date range for 100 of the largest global companies.
As far as I can tell, of the data sets that I have access to, there
are only two that contain corporate factor data: IBES and Compustat.
The IBES data also includes analysts forcasts.
The IBES data set can be selected in a variety of ways. The IBES Detail
History - Actuals data set appears to be the most promising when
it comes to corporate factors (e.g., earnings per share, cash flow per
share). Here "actual" values are in contrast to the forecast values.
The IBES data is surprising in its ommissions. Almost every stock has
periods where there are no values provided for Book Value per Share,
Cash Flow per Share and Return on Equity. This makes this data set
difficult or impossible to use. Given what IBES charges for data I can
only hope that they provide better quality for their industry
subscribers.
IBES Detail History - Actuals
The IBES database has quarterly stock factor data. I experimented
with selecting the factors shown below:
-
EPS - Earnings per share
-
BPS - Book Value Per share
-
CPS - Cash Flow Per Share
-
CSH - Cash Earnings Per Share
-
DPS - Dividend Per Share
-
EBG - Earnings per share - before goodwill
-
EBS - EBITDA per share
-
FFO - Funds from operations per share
-
GPS - GAAP/Earnings Per share - fully reported
-
GRM - Gross margin (percent, GRM)
-
OPR - Operating Profit (non-per share)
-
ROA - Return on Assets (percent)
-
ROE - Return on Equity (percent)
-
SAL - Revenue (non per share)
The SAL factor (revinue non-per-share) does not seem to be a useful
factor since it needs to be scaled by the number of shares or the
corporate size (capitalization).
Unlike the Compustat data, which is returned in tabular form, the IBES
data is returned with one factor per line. This is shown below. The
column names are:
| OFTIC | Official ticker |
| TICKER | IBES ticker |
| PENDS | period end |
| MEASURE | e.g., the factor EPS, BPS, CPS... |
| PDICITY | periodicity (e.g., quarterly, yearly) |
| VALUE | the factor value |
| ANNDATES | Announcement date |
OFTIC,TICKER,PENDS,MEASURE,PDICITY,VALUE,ANNDATS
AEP,AEP,12/31/2004,EPS,QTR,0.42,01/27/2005
AEP,AEP,03/31/2005,EPS,QTR,0.88,04/28/2005
AEP,AEP,06/30/2005,EPS,QTR,0.61,07/29/2005
AEP,AEP,09/30/2005,EPS,QTR,0.95,10/27/2005
AEP,AEP,12/31/2005,EPS,QTR,0.29,02/01/2006
AEP,AEP,03/31/2006,EPS,QTR,0.96,04/27/2006
AEP,AEP,06/30/2006,EPS,QTR,0.44,07/27/2006
AEP,AEP,03/31/2006,BPS,QTR,23.82,04/28/2006
...
AEP,AEP,06/30/2006,BPS,QTR,23.8,07/27/2006
AEP,AEP,09/30/2006,BPS,QTR,24.05,10/31/2006
AEP,AEP,12/31/2006,BPS,QTR,23.83,01/30/2007
AEP,AEP,03/31/2007,BPS,QTR,23.94,04/26/2007
AEP,AEP,06/30/2007,BPS,QTR,24.22,07/31/2007
AEP,AEP,09/30/2007,BPS,QTR,24.76,10/24/2007
AEP,AEP,12/31/2007,BPS,QTR,25.31,01/29/2008
AEP,AEP,03/31/2008,BPS,QTR,,04/28/2008
To allow this data be used in an environment like R the data needs to
be in a tabular format, like that shown below:
| sym | date | anndate | BPS | CPS | CSH | DPS | EBG | EBS | EPS | FFO | GPS | GRM | ROA | ROE | SAL |
| AEP | 2004-12-31 | 2005-01-27 | NA | 0.447 | NA | 0.35 | NA | NA | 0.42 | NA | 0.42 | NA | NA | NA | 3500.0
|
| AEP | 2005-03-31 | 2005-04-28 | NA | 0.7685 | NA | 0.35 | NA | NA | 0.88 | NA | 0.9 | NA | NA | NA | 3000.0
|
| AEP | 2005-06-30 | 2005-07-29 | NA | 0.7765 | NA | 0.35 | NA | NA | 0.61 | NA | 0.58 | NA | NA | NA | 2800.0
|
| AEP | 2005-09-30 | 2005-10-27 | NA | 1.8355 | NA | 0.35 | NA | NA | 0.95 | NA | 0.99 | NA | NA | NA | 3300.0
|
| AEP | 2005-12-31 | 2006-02-01 | NA | 0.354 | NA | 0.37 | NA | NA | 0.29 | NA | -0.38 | NA | NA | NA | 2900.0
|
| AEP | 2006-03-31 | 2006-04-27 | 23.82 | 1.8 | NA | 0.37 | NA | NA | 0.96 | NA | 0.97 | NA | 1.06 | 11.69 | 3100.0
|
| AEP | 2006-06-30 | 2006-07-27 | 23.8 | 1.53 | NA | 0.37 | NA | NA | 0.44 | NA | 0.44 | NA | 0.47 | 10.98 | 2900.0
|
| AEP | 2006-09-30 | 2006-10-31 | 24.05 | 2.28 | NA | 0.37 | NA | 2.89 | 0.99 | NA | 0.67 | NA | 1.08 | 11.09 | 3600.0
|
| AEP | 2006-12-31 | 2007-01-30 | 23.83 | NA | NA | 0.39 | NA | 2.89 | 0.38 | NA | 0.46 | NA | 0.4 | 11.61 | 3000.0
|
| AEP | 2007-03-31 | 2007-04-26 | 23.94 | NA | NA | 0.39 | NA | 2.35 | 0.68 | NA | 0.68 | NA | 0.71 | 10.34 | 3200.0
|
| AEP | 2007-06-30 | 2007-07-31 | 24.22 | NA | NA | 0.39 | NA | 2.31 | 0.64 | NA | 0.45 | NA | 0.66 | 11.09 | 3100.0
|
| AEP | 2007-09-30 | 2007-10-24 | 24.76 | NA | NA | 0.39 | NA | 3.31 | 1.16 | NA | 1.02 | NA | 1.17 | 11.51 | 3800.0
|
| AEP | 2007-12-31 | 2008-01-29 | 25.31 | NA | NA | 0.41 | NA | NA | 0.52 | NA | 0.58 | NA | 0.52 | 11.9 | 3300.0
|
| AEP | 2008-03-31 | 2008-04-24 | NA | 1.56 | NA | 0.41 | NA | 2.9 | 1.02 | NA | 1.43 | 64.15 | NA | NA | 3467.0
|
Note that NA has been filled in for missing values.
I wrote a Java program (ConvertData.java) to convert the
WRDS IBES value per line data into the table shown above (a
downloadable form can be found here).
The WRDS query interface allows you to select a file on your local
system that contains the stock ticker symbols for the query. I used a
file that contained the S&P 100 stocks (note that the composition of
the S&P 100 and other indexes change over time):
|
S&P 100 Stocks (as of October 2013)
|
| AAPL | ABBV | ABT | ACN | AEP | AIG | ALL | AMGN | AMZN | APA |
| APC | AXP | BA | BAC | BAX | BK | BMY | BRK.B | C | CAT |
| CL | CMCSA | COF | COP | COST | CSCO | CVS | CVX | DD | DIS |
| DOW | DVN | EBAY | EMC | EMR | EXC | F | FCX | FDX | FOXA |
| GD | GE | GILD | GM | GOOG | GS | HAL | HD | HON | HPQ |
| IBM | INTC | JNJ | JPM | KO | LLY | LMT | LOW | MA | MCD |
| MDLZ | MDT | MET | MMM | MO | MON | MRK | MS | MSFT | NKE |
| NOV | NSC | ORCL | OXY | PEP | PFE | PG | PM | QCOM | RTN |
| SBUX | SLB | SO | SPG | T | TGT | TWX | TXN | UNH | UNP |
| UPS | USB | UTX | V | VZ | WAG | WFC | WMB | WMT | XOM |
You can download the stocks in list form here.
Although the IBES search has a check box for each of the factors
above, many of them have no data or many missing values (for example,
CPH, EBG, FFO, GRM). In some cases, not all time periods have all of
the factors selected in the query (e.g., values are not supplied
as empty values, but are omitted entirely for the time period).
I tried selecting fewer factors and got a data set with fewer missing
values. For some stocks there are still enough missing values to make this data
set problematic.
| sym | date | anndate | BPS | CPS | DPS | EPS | ROE | SAL |
| BA | 2005-03-31 | 2005-04-27 | 14.23 | 1.755 | 0.25 | 0.66 | 15.32 | 12987.0
|
| BA | 2005-06-30 | 2005-07-27 | 13.79 | 1.87 | 0.25 | 0.7 | 15.62 | 15028.0
|
| BA | 2005-09-30 | 2005-10-26 | 11.74 | 1.84 | 0.25 | 1.26 | 24.37 | 12629.0 |
| BA | 2005-12-31 | 2006-02-01 | 13.97 | 1.862 | 0.25 | 0.58 | 23.28 | 14204.0 |
| BA | 2006-03-31 | 2006-04-26 | 14.55 | 1.84 | 0.3 | 0.88 | 23.71 | 14264.0 |
| BA | 2006-06-30 | 2006-07-26 | 13.62 | 0.73 | 0.3 | -0.21 | 19.33 | 14986.0 |
| BA | 2006-09-30 | 2006-10-25 | 14.06 | 2.25 | 0.3 | 0.89 | 15.29 | 14739.0 |
| BA | 2006-12-31 | 2007-01-31 | 6.02 | 3.12 | 0.3 | 1.29 | 46.74 | 17541.0 |
| BA | 2007-03-31 | 2007-04-25 | 7.22 | 0.94 | 0.35 | 1.12 | 42.7 | 15365.0 |
| BA | 2007-06-30 | 2007-07-25 | 7.54 | 4.68 | 0.35 | 1.35 | 61.55 | 17028.0 |
| BA | 2007-09-30 | 2007-10-24 | 8.28 | 4.3 | 0.35 | 1.43 | 62.75 | 16517.0 |
| BA | 2007-12-31 | 2008-01-30 | 11.83 | 2.49 | 0.35 | 1.35 | 45.07 | 17477.0 |
| BA | 2008-03-31 | 2008-04-23 | 12.13 | 2.59 | 0.4 | 1.61 | 48.43 | 15990.0 |
The IBES time series with the fewest missing values is the earnings
per share actual value. However, not all dates are covered.
S&P 500 Index Components
Compustat Monthly Updates - Index Constituents
Stocks are added and removed from the S&P 500 over time. When modeling
portfolio performance with historical data it is important to use the
historical S&P 500 to avoid survivor bias. Also, some stocks, like
Google, have existed only relatively recently.
In order to download the historical S&P 500, the index for various
time periods must be calculated. Some stocks do not exist anymore and
are replaced by CRSP/Compustat codes. A file of GVKEY values must be
generated to download the factors discussed here. See Building
the S&P 500 Constituents. The web page include a link to R code
that will build the index and the GVKEY file.
Forrester Research analyst Sucharita Mulpuru told the Times that
Amazon was "the teacher's pet of Wall Street," because no other company
in the world "has the consistently abominable rate of profitability
they do and yet has the stratospheric valuation they do."
http://www.salon.com/2013/10/25/why_wall_street_cant_quit_amazon
The raw numbers would seem to indicate that Microsoft is killing it
while Amazon is floundering. But Wall Street disagrees: On Friday
morning Microsoft's stock price hovered around $35 per share while Amazon rose
to $357.
http://www.salon.com/2013/10/25/what_microsoft_profits_say_about_amazon_losses/Microsoft
Of the databases available on WRDS, the CRSP/Compustat combined database seems to be the most extensive
database of fundamental corporate information. This is the core data
that I used for my Masters presentation.
This data consists of corporate factors from the quarterly
corporate filings.
Corporations in different industrial sections differ in fundamental
ways. A transportation company (trucking, railroad) has large capital
equipment expenditures and depreciation, but no research and
development expenses. A pharmaceutical company has research and
develpment costs, capital costs for drug manufacture and
depreciation. A software company has research and development costs
but low capital expenses (outside of buildings and computers). Each
of these companies will have different corporate factors.
Corporate reports contain a staggering number of categories. For
those of us without the benefit of MBA or CPA graduate degrees, some of these
factors are confusing. Another problem is that in many cases there
are missing factors.
The tables below show the density of the factors, relative to the S&P
500 from January 1998 to September 2013. For example,
[100.00:95.00] means that between 95 and 100 percent of the values are
present (e.g., not NA).
In some cases the fact values are missing is valid. For example, not
all stocks have dividends, so it is reasonable that dividend values
are missing for some stocks.
[100.00:95.00]
| PRCCQ | CSHPRQ | CSH12Q | SALEQ | IBADJQ | IBCOMQ | ATQ | LSEQ |
| IBQ | LTMIBQ | NIQ | LTQ | SEQQ | ICAPTQ | PIQ | CSHOQ |
| AOQ | CHEQ | EPSPIQ | EPSFIQ | CEQQ | OPEPSQ | EPSPXQ | COGSQ |
| EPSFXQ | XOPRQ | EPSX12 | OEPS12 | OIADPQ | CSHFDQ | DILAVQ | OEPSXQ |
| EPSF12 | TXTQ | APQ | RECTQ | REQ | CSTKQ | OANCFY | CHECHY |
[95.00:90.00]
| REVTQ | LOQ | PPENTQ | OEPF12 | DLTTQ | OIBDPQ |
[90.00:85.00]
[85.00:80.00]
| LCOQ | LCTQ | ACTQ | WCAPQ | XINTQ | DLCQ | INVTQ |
[80.00:75.00]
| XSGAQ | ANCQ | LLTQ | IBADJ12 | SPCEPQ |
[75.00:70.00]
| SPCEEPSPQ | SPCEDPQ | SPCEQ | SPCEEPSQ | SPCEDQ |
[70.00:65.00]
| SPCEP12 | SPCEEPSP12 | SPCEPD12 | REUNAQ | DPACTQ | PPEGTQ | SPCE12 | SPCEEPS12 |
| SPCED12 | ACOMINCQ |
[65.00:60.00]
[60.00:55.00]
[55.00:50.00]
| TXDITCQ | TSTKNQ | TXPQ | LOXDRQ | SPIQ |
[50.00:45.00]
| CITOTALQ | PNCWIAPQ | PNCWIPPQ | CIBEGNIQ | PNCPQ | STKCOQ | PNCWIAQ | PNCWIPQ |
PNCQ | INTANOQ | RECTRQ | GLCEA12 |
|
[45.00:40.00]
[40.00:35.00]
| CHQ | GLCEEPS12 | GLCED12 | IVLTQ | PRCPQ | CICURRQ | PRCRAQ | MIBTQ |
| CSHOPQ |
[35.00:30.00]
| PRCAQ | PNCPEPSQ | PNCPDQ | PNCEPS12 | PNCD12 | PNCEPSQ | PNCDQ | PRCE12 |
| PNCPEPS12 | PNCPD12 | MIIQ | GLCEPQ | PNCWIEPQ | XRDQ | PNCWIDPQ | PNCWIEPSQ |
| RECTAQ | PNCWIDQ | XOPTQP | GLCEAQ |
[30.00:25.00]
| CIDERGLQ | AOCIPENQ | TEQQ | XIDOQ | XOPTEPSQP | XOPTDQP | TFVAQ | AOCIDERGLQ |
| CIPENQ | XOPTQ | RCPQ | CISECGLQ |
[25.00:20.00]
| RECDQ | CIQ | TXDIQ | XOPT12 | MIBQ | RCAQ | IBMIIQ | AOL2Q |
| XOPTEPSP12 | XOPTD12P | MSAQ | XOPTD12 | XOPTEPS12 | DOQ | OPTVOLQ | OPTRFRQ |
| OPTLIFEQ | XOPTEPSQ | XOPTDQ | TFVLQ | AQPL1Q | PNCIAPQ | PNCIPPQ | STKCPAQ |
| INVFGQ | GLCEEPSQ | GLCEDQ | IVSTQ | LOL2Q | RECTOQ |
[20.00:15.00]
| PNCIAQ | PNCIPQ | RCDQ | RCEPSQ | SETA12 | INVRMQ | PSTKQ | SETEPS12 |
| SETD12 | PNCIEPSPQ | PNCIDPQ | DVPQ | FCAQ | INVWIPQ | DRCQ | PNCIEPSQ |
| PNCIDQ |
[15.00:10.00]
| PSTKNQ | OPTFVGRQ | OPTDRQ | PRCEPS12 | PRCD12 | MIBNQ | PRCPEPSQ | PRCEPSQ |
| PRCDQ | PRCPDQ | PRCPEPS12 | PRCPD12 | RRA12 | CIMIIQ | AUL3Q | DILADQ |
[10.00:5.00]
| SPIOPQ | TXDBQ | AQPQ | SPIOAQ | DRLTQ | AQAQ | DCOMQ | SETPQ |
| SETAQ | CIOTHERQ | AOCIOTHERQ | SPIDQ | SPIEPSQ | LUL3Q | NRTXTQ | GDWLIA12 |
| GLPQ | SETDQ | WDPQ | AQDQ | SETEPSQ | GLAQ | GDWLID12 | GDWLIEPS12 |
| AQEPSQ | NRTXTDQ | WDAQ | DTEPQ | NRTXTEPSQ | RREPS12 | RRD12 | DTEAQ |
| LQPL1Q | UCEQQ | UACOQ | ULCOQ | UGIQ | UNIAMIQ | UOPIQ | URECTQ |
| PNRSHOQ | UAOQ | UINVQ | UNOPINCQ | UAPTQ | WDDQ | WDEPSQ | CSTKEQ |
| GLDQ | GLEPSQ | HEDGEGLQ | RRPQ | RRAQ | IVAOQ | GDWLAMQ | DTEDQ |
| DTEEPSQ |
[5.00:0.00]
| RLLQ | TIEQ | TIIQ | PSTKRQ | ESOPCTQ | NIMQ | NPATQ | PLLQ |
| NCOQ | CAPR3Q | CAPR1Q | CAPR2Q | INVOQ | NIITQ | INTACCQ | DD1Q |
| USUBPCVQ | XIQ | TXDBCAQ | UCAPSQ | XACCQ | ESUBQ | OBKQ | TXDBAQ |
| USUBDVPQ | GDWLIPQ | RREPSQ | GDWLIAQ | RRDQ | UDOLTQ | IVAEQQ | ANOQ |
| LNOQ | ACCHGQ | GDWLIDQ | GDWLIEPSQ | NPQ | USPIQ | RDIPQ | RETQ |
| RDIPAQ | DPACREQ | RECUBQ | DPRETQ | SEQOQ | ESOPTQ | TXWQ | RDIPDQ |
| RDIPEPSQ | UDMBQ | TFVCEQ | PRSHOQ | UDDQ | UPMCSTKQ | TXDBCLQ | UDPCOQ |
| FFOQ | UTEMQ | UPSTKQ | SRETQ | UDVPQ | ESOPNRQ | ARCEDQ | ARCEEPSQ |
| ARCEQ | ESOPRQ | UPMPFQ | UPMSUBPQ | AOCISECGLQ | UPDVPQ | UPSTKCQ | UCCONSQ |
| UPMPFSQ |
In most cases factors that don't have at least 2/3s of their values
are not going to be useful. The tables below list the factors, with
the description provided by Compustat.
[100.00:95.00]
| PRCCQ | Price Close - Quarter |
| CSHPRQ | Common Shares Used to Calculate Earnings Per Share
- Basic |
| CSH12Q | Common Shares Used to Calculate Earnings Per Share
- 12 Months Moving |
| SALEQ | Sales/Turnover (Net) |
| IBADJQ | Income Before Extraordinary Items - Adjusted for
Common Stock Equivalents |
| IBCOMQ | Income Before Extraordinary Items - Available for Common |
| ATQ | Assets - Total |
| LSEQ | Liabilities and Stockholders Equity - Total |
| IBQ | Income Before Extraordinary Items |
| LTMIBQ | Liabilities - Total and Noncontrolling Interest |
| NIQ | Net Income (Loss) |
| LTQ | Liabilities - Total |
| SEQQ | Stockholders Equity <Parent <Index Fundamental <Quarterly |
| ICAPTQ | Invested Capital - Total - Quarterly |
| PIQ | Pretax Income |
| CSHOQ | Common Shares Outstanding |
| AOQ | Assets - Other - Total |
| CHEQ | Cash and Short-Term Investments |
| EPSPIQ | Earnings Per Share (Basic) - Including
Extraordinary Items |
| EPSFIQ | Earnings Per Share (Diluted) - Including
Extraordinary Items |
| CEQQ | Common/Ordinary Equity - Total |
| OPEPSQ | Earnings Per Share from Operations |
| EPSPXQ | Earnings Per Share (Basic) - Excluding
Extraordinary Items |
| COGSQ | Cost of Goods Sold |
| EPSFXQ | Earnings Per Share (Diluted) - Excluding
Extraordinary items |
| XOPRQ | Operating Expense- Total |
| EPSX12 | Earnings Per Share (Basic) - Excluding
Extraordinary Items - 12 Months Moving |
| OEPS12 | Earnings Per Share from Operations - 12 Months Moving |
| OIADPQ | Operating Income After Depreciation - Quarterly |
| CSHFDQ | Common Shares for Diluted EPS |
| DILAVQ | Dilution Available - Excluding Extraordinary Items |
| OEPSXQ | Dilution Available - Excluding Extraordinary Items |
| EPSF12 | Earnings Per Share (Diluted) - Excluding
Extraordinary Items - 12 Months Mo |
| TXTQ | Income Taxes - Total |
| APQ | Account Payable/Creditors - Trade |
| RECTQ | Receivables - Total |
| REQ | Retained Earnings |
| CSTKQ | Common/Ordinary Stock (Capital) |
| OANCFY | Operating Activities - Net Cash Flow |
| CHECHY | Cash and Cash Equivalents - Increase (Decrease) |
[95.00:90.00]
| REVTQ | Revenue - Total |
| LOQ | Liabilities - Other |
| PPENTQ | Property Plant and Equipment - Total (Net) |
| OEPF12 | Earnings Per Share - Diluted - from Operations - 12MM |
| DLTTQ | Long-Term Debt - Total |
| OIBDPQ | Operating Income Before Depreciation - Quarterly |
[90.00:85.00]
| DPQ | Depreciation and Amortization - Total |
| NOPIQ | Non-Operating Income (Expense) - Total |
| CSHIQ | Common Shares Issued |
| CAPSQ | Capital Surplus/Share Premium Reserve |
| ACOQ | Current Assets - Other - Total |
[85.00:80.00]
| LCOQ | Current Liabilities - Other - Total |
| LCTQ | Current Liabilities - Total |
| ACTQ | Current Assets - Total |
| WCAPQ | Working Capital (Balance Sheet) |
| XINTQ | Interest and Related Expense- Total |
| DLCQ | Debt in Current Liabilities |
| INVTQ | Inventories - Total |
[80.00:75.00]
| XSGAQ | Selling, General and Administrative Expenses |
| ANCQ | Non-Current Assets - Total |
| LLTQ | Long-Term Liabilities (Total) |
| IBADJ12 | Income Before Extra Items - Adj for Common Stock
Equivalents - 12MM |
| SPCEPQ | S&P Core Earnings - Preliminary |
[75.00:70.00]
| SPCEEPSPQ | S&P Core Earnings EPS Basic - Preliminary |
| SPCEDPQ | S&P Core Earnings EPS Diluted - Preliminary |
| SPCEQ | S&P Core Earnings |
| SPCEEPSQ | S&P Core Earnings EPS Basic |
| SPCEDQ | S&P Core Earnings EPS Diluted |
[70.00:65.00]
| SPCEP12 | S&P Core Earnings 12MM - Preliminary |
| SPCEEPSP12 | S&P Core 12MM EPS - Basic - Preliminary |
| SPCEPD12 | S&P Core Earnings 12MM EPS Diluted - Preliminary |
| REUNAQ | Unadjusted Retained Earnings |
| DPACTQ | Depreciation, Depletion and Amortization (Accumulated) |
| PPEGTQ | Property, Plant and Equipment - Total (Gross) - Quarterly |
| SPCE12 | S&P Core Earnings 12MM |
| SPCEEPS12 | S&P Core Earnings EPS Basic 12MM |
| SPCED12 | S&P Core Earnings EPS Diluted 12MM |
| ACOMINCQ | Accumulated Other Comprehensive Income (Loss) |
[65.00:60.00]
| ALTOQ | Other Long-term Assets |
| DVPSPQ | Dividends per Share - Pay Date - Quarter |
| INTANQ | Intangible Assets - Total |
| CSTKCVQ | Carrying Value |
Most of the Compustat corporate factors listed in the table below are used to
build the factors described in Chapter 5 of Quantitative Equity
Portfolio Management by Qian, Hua and Sorensen. As the table
shows, most of these factors have few missing values.
In some cases, dividends (DVPSPQ), missing values are not unexpected,
since not all companies pay dividends.
| Compustat Factors |
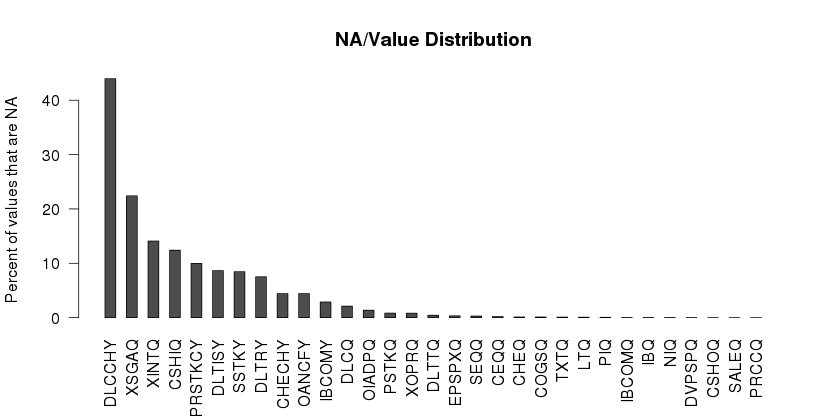
| Compustat Code | Explanation | Percent NA (after data cleaning) |
| CEQQ | Common/Ordinary Equity - Total | 0.21 |
| CHECHY | Cash and Cash Equivalents - Increase (Decrease) | 4.44 |
| CHEQ | Cash and Short-Term Investments | 0.13 |
| COGSQ | Cost of Goods Sold | 0.12 |
| CSHIQ | Common Shares Issued | 12.41 |
| CSHOQ | Common Shares Outstanding (thousands) | 0 |
| DLCCHY | Changes in Current Debt | 43.96 |
| DLCQ | Debt in Current Liabilities | 2.12 |
| DLTISY | Long-Term Debt - Issuance | 8.66 |
| DLTRY | Long-Term Debt - Reduction | 7.52 |
| DLTTQ | Long-Term Debt - Total (millions) | 0.44 |
| DVPSPQ | Dividends per Share - Pay Date - Quarter | 0.02 |
| DVY | Cash Dividends | 0.02 |
| EPSPXQ | Earnings Per Share (Basic) - Excluding Extraordinary Items | 0.34 |
| IBCOMQ | Income Before Extraordinary Items - Available for Common | 0.03 |
| IBQ | Income Before Extraordinary Items | 0.03 |
| LTQ | Liabilities - Total | 0.09 |
| NIQ | Net Income (Loss) | 0.03 |
| OANCFY | Operating Activities - Net Cash Flow (year to date) | 4.44 |
| OIADPQ | Operating Income After Depreciation - Quarterly | 1.38 |
| PIQ | Pretax Income | 0.06 |
| PRCCQ | Price Close - Quarter | 0 |
| PRSTKCY | Purchase of Common and Preferred Stock | 9.99 |
| PSTKQ | Preferred/Preference Stock (Capital) - Total | 0.84 |
| SALEQ | Sales/Turnover (Net) | 0 |
| SEQQ | Stockholders Equity <Parent <Index Fundamental <Quarterly | 0.30 |
| SSTKY | Sale of Common and Preferred Stock | 8.45 |
| TXTQ | Income Taxes - Total | 0.10 |
| XINTQ | Interest and Related Expense- Total | 14.10 |
| XOPRQ | Operating Expense- Total | 0.83 |
| XSGAQ | Selling, General and Administrative Expenses (millions) | 22.41 |
Note:
In the CRSP/Compustat data the REVTQ (quarterly revenue) and SALEQ
(quarterly sales) values seem to be the same. There are fewer missing
values for SALEQ, so this value is used rather than REVTQ.
The distribution of NA (not present) values after interpolation for
quarterly values is shown below:
Additional Metadata
In some cases the date defined in the datadate column is incorrect. To allow cleaning
and filtering software to fix the dates the metadata fields (from
CRSP/Compustat) should be included.
| Metadata Fields |
| gvkey |
| datadate |
| fyear |
| fqtr |
| tic |
| conm |
| DATAFQTR |
| GGROUP |
| GSECTOR |
If you want additional verification you can also include the
DATAFQTR column in the data. This value (e.g., 1998Q1, 1998Q2)
mirrors the fyear and fqtr columns.
The GGROUP and GSECTOR are Global
Industry Classification Standard values
In our recollection, we have never encountered a large,
real-world dataset that was directly usable without data
cleaning.
Scaling Big Data Mining Infrastructure:
The Twitter Experience by Jimmy Lin and Dmitriy Ryaboy, SIGKDD
Explorations, V14, Issue 2, 2012
Fixing Date Values
The table below of Google (GOOG) data shows the correct format for the
dates. Note that the date in the datadate field mirrors the
year and quarter in the fyearq and fqtr columns.
| Consistent Data Values |
| gvkey | datadate | fyearq | fqtr | tic | conm | DATAFQTR | ATQ | etc |
| 160329 | 09/30/2004 | 2004 | 3 | GOOG | GOOGLE INC | 2004Q3 | 2888.5180 | ... |
| 160329 | 12/31/2004 | 2004 | 4 | GOOG | GOOGLE INC | 2004Q4 | 3313.3510 | ... |
| 160329 | 03/31/2005 | 2005 | 1 | GOOG | GOOGLE INC | 2005Q1 | 3865.1990 | ... |
| 160329 | 06/30/2005 | 2005 | 2 | GOOG | GOOGLE INC | 2005Q2 | 4497.7180 | ... |
| 160329 | 09/30/2005 | 2005 | 3 | GOOG | GOOGLE INC | 2005Q3 | 9451.0010 | ... |
| 160329 | 12/31/2005 | 2005 | 4 | GOOG | GOOGLE INC | 2005Q4 | 10271.8130 | ... |
The data below for Mylan Inc (MYL) shows an example where the date in
the datadate column is wrong. I have tried to check this data against
finance.yahoo.com data. It is hard to exactly match up the values,
but it does apepar that the fyearq and fqtr close price
is the correct one.
Along with being inaccurate, this date problem causes an error in R's
indexes since some datadate values are repeated.
| Inconsistent Data Values |
| gvkey | datadate | fyearq | fqtr | tic | conm | DATAFQTR | ATQ | etc |
| 007637 | 03/31/1998 | 1997 | 4 | MYL | MYLAN INC | 1997Q4 | 847.7530 | ... |
| 007637 | 06/30/1998 | 1998 | 1 | MYL | MYLAN INC | 1998Q1 | 890.8990 | ... |
| 007637 | 09/30/1998 | 1998 | 2 | MYL | MYLAN INC | 1998Q2 | 924.4280 | ... |
| 007637 | 12/31/1998 | 1998 | 3 | MYL | MYLAN INC | 1998Q3 | 1158.3130 | ... |
| 007637 | 03/31/1999 | 1998 | 4 | MYL | MYLAN INC | 1998Q4 | 1206.6610 | ... |
| 007637 | 06/30/1999 | 1999 | 1 | MYL | MYLAN INC | 1999Q1 | 1241.1060 | ... |
| 007637 | 09/30/1999 | 1999 | 2 | MYL | MYLAN INC | 1999Q2 | 1259.8280 | ... |
| 007637 | 12/31/1999 | 1999 | 3 | MYL | MYLAN INC | 1999Q3 | 1309.0420 | ... |
| 007637 | 03/31/2000 | 1999 | 4 | MYL | MYLAN INC | 1999Q4 | 1341.2300 | ... |
| 007637 | 06/30/2000 | 2000 | 1 | MYL | MYLAN INC | 2000Q1 | 1364.8180 | ... |
The CRSP/Compustat Merged Database - Fundamentals Quarterly
data is extracted from the quarterly reports that public companies,
traded on US exchanges, are required to file with the SEC. There are
many factors and not all apply to all companies, so some will
naturally be zero (blank).
There are other data values that should be reported and present for all
companies. However, there are cases where these critical values are
missing in the CRSP/Compustat data.
Before the Compustat data can be used, it must be processed to add
critical values that are missing. Adding interpolated values is better
than a missing value, but this may result in estimation error.
-
CSHOQ - Common shares outstanding
This value must always be present since it is used to calculate the
market value (MV) and enterprise value (EV) for a company. If this
value is missing, it is filled in by interpolation from surrounding values.
-
PRCCQ - Quarterly close price.
If the stock is still trading the quarterly close price can be
obtained from finance.yahoo.com. If the stock is no longer
trading the value is filled in by interpolating from neighboring values
-
SALEQ - quarterly sales
This is a critical value for calculating EBITDA. If values are missing
they are filled in by interpolation.
-
CEQQ - common equity
LTQ - libilities (total)
NIQ - Net income
If there are fewer than four sequential missing values, the values are
filled in by interpolation.
Filling in missing stock values
The R package tseries includes a function, get.hist.quote, which can
be used to fetch stock values form Internet sources like
finance.yahoo.com.
The historical S&P 500 includes stocks for
companies that have been purchased by other companies or have otherwise
gone out of business (Lehman Brothers, for example). The tickers for
these stocks have been replaced by CRSP/Compustat symbols. If these
symbols are passed to the get.hist.quote function there will be an
error. This error is not an exception that can be
caught, if the quote cannot be read. This will cause the R script to terminate.
To avoid this, the R function below can be used to check whether a value can be read from
Yahoo before calling get.hist.quote().
#
# Return TRUE if the stock, on date, can be read from Yahoo
#

canGetStockInfo = function(ticker, date)
{
  start = date
  end = date
  url <- paste("http://chart.yahoo.com/table.csv?s=", ticker,
               format(start, "&a=%m&b=%d&c=%Y"),
               format(end, "&d=%m&e=%d&f=%Y"), "&g=d&q=q&y=0&z=",
	       ticker, "&x=.csv", sep = "")
  page = getURL(url)
  ix = grep(pattern="404 Not Found", x = page)
  readURL = (length(ix) == 0)
  return(readURL)
}
The factors in this section are discussed in Chapter 5 of
Quantitative Equity Portfolio Management by Qian, Hua and
Sorensen, Chapman and Hall, 2007. These factors are synthesized from
the Compustat quarterly data (except for the earnings forecast, which
can be obtained from IBES).
In Appendex A5.1 of Qian et al there is a description of how these
factors are calculated from the Compustat
data. Unfortunately the current Compustat data available from WRDS in
2013 has a different structure. Qian et al use an obsolete Compustat
quarterly data schema, is described here.
I have listed below the calculation I have used for the selected Qian et al factors.
-
MV = market value
|
MV = CSHOQ (shares outstanding) * PRCCQ (share price)
|
-
EV = Enterprise Value - The enterprise value is what it would cost to buy
the company. This includes the market capitalization, preferred stock
or debt (a purchaser must pay of the debt to buy the company). Cash
and cash equivalents is subtracted since once the purchaser owns the
company the cash can be used to pay back part of the cost of purchase.
EV = [MV + ((debt in current liabilities) + (long term debt total) + (Preferred/Preference Stock (Capital))] - (Cash and Short-Term Investments)
EV = (MV + DLCQ + DLTTQ + PSTKQ) - CHEQ
|
-
tax rate
Interest paid is multiplied by the tax rate to produce a credit, since
corporations can deduct interest.
Qian et al calculate the cash flow numerator as: CFO + (interest
expense x (1 - tax rate)). The tax rate is not available in the
current Compustat as a percentage.
As it turns out, the corporate tax rate is complex and a lot of ink
has been spilled on this topic. See, for example, John R. Graham's
web page
discussing this.
Prof. Graham provides the tax rates for a huge number of stocks, from
1980 to 2012. However, his data has missing values (for example, some,
but not all stocks have Compustat GVKEY values).
I have calculated tax rates by dividing the quarterly taxes paid by
the pretax income.
The income tax distribution is shown below (after cleaning up the data):
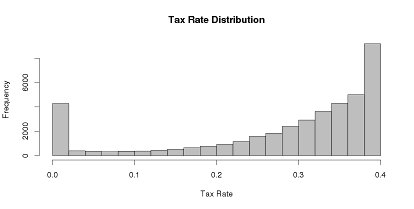
The mean is 28% which turns out to the the mean reported tax rate in
the US. Note that the mean actual taxes paid by corporations in the
US is less than half of this (~12%).
-
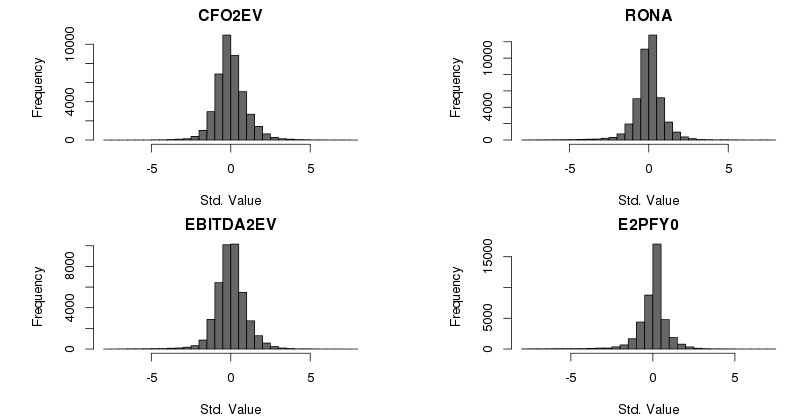
CFO2EV - Cash Flow from Operations to Enterprise Value
Cash flow is "cash flow from operating activities". This value is not
available directly on a quarterly basis. However, Compustat does
include a year-to-date value, OANCFY. By subtracting quarter t from
quarter t+1 the quarterly value can be arrived at.
CFO2EV = (Operating Activities Net Cash Flow) + ((Interest and Related Expense) x (1 - tax_rate))
ΔCFO = OANCFYt+1 - OANCFYt
CFO2EV = CFO + (XINTQ x (1 - tax_rate))
|
-
RONA - Return on net operating assets
ASSETS = (common equity) + ((debt in current liabilities) + (long term debt total) + (Preferred/Preference Stock (Capital))] - (Cash and Short-Term Investments)
ASSETS = (CEQQ + DLCQ + DLTTQ + PSTKQ) - CHEQ
RONA = [(Income Before Extraordinary Items) + ((Interest and Related Expense) x (1 - tax_rate))]/ASSETS
RONA = [IBQ + (XINTQ x (1 - tax_rate))]/ASSETS
|
-
EBITDA2EV - Earnings before Interest, Taxes, Depreciation and
Amortization to Enterprise Value
The EBITDA value is only available in the annual Compustat data.
EBITDA can be calculated as:
EBITDA = sales - (cost of goods) - (Selling, General, and Administrative Expense )
EBITDA = SALEQ - COGSQ - XSGAQ
EBITDA2EV = EBITDA / EV
|
-
E2PFY0 - Trailing 12-month earnings to market capitalization
E2PFY0 = (Income Before Extraordinary Items - Available for Common)/MV
E2PFY0 = IBCOMQ/MV
|
-
E2PFY1 - Earnings yield of IBES's EPS (earnings per share)
consensus estimate of the next fiscal year.
This estimate can be obtained form the WRDS IBES data (Detail History
- Detail File with Actuals)
-
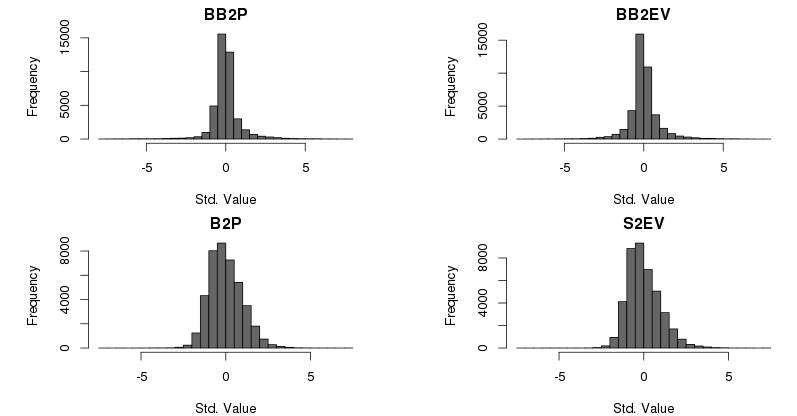
BB2P -Net buyback to market capitalization
BB2P = ([Cash Dividend] + [Total Shares Repurchased]) - (Sale of
Common an Preferred Stock)/MV
BB2P = [(DVY + PRSTKCY) - SSTKY]/MV
|
-
BB2EV - net external financing to enterprise value
EQ_REPO = equity repurchase
EQ_REPO = ([Total Shares Repurchased] - [Sale of Common and Preferred Stock])
EQ_REPO = PRSTKCY - SSTKY
DEBT_REPO = [Long-Term Debt - Reduction] - [Changes in Current Debt] - [Long-Term Debt - Issuance]
DEBT_REPO = DLTRY - DLCCHY - DLTISY
BB2EV = [([Cash Dividend] + EQ_REPO) - DEBT_REPO]/EV
BB2EV = [(DVY + EQ_REPO) - DEBT_REPO]/EV
|
-
B2P - Book to market capitalization
|
B2P = CEQQ (common/ordinary equity) / MV (market value)
|
-
S2EV - sales-to-enterprise value
|
S2EV = SALEQ (sales) / EV
|
Preprocessing Factor Data
In the CRSP/Compustat data the yearly values are "year-to-date"
values. For example, if cash grows by 2 million a quarter, in the
first quarter the cash will be 2 million, then 4 million in the second
quarter, 6 million in the third quarter and 8 million in the fourth
quarter. If the progression continues, then in the first quarter of
the next year the cash will again be 2 million.
The yearly factors must be preprocessed to generate the quarterly
values before they are used. The yearly factors used above are:
DLTISY
DLTRY
OANCFY
Distribution of the Value Factors
The plots below show the distributions of the standardized value factors synthesized from the
corporate values from the S&P 500 stock universe over the period 1998
through 2013 (a distribution is standardized by subtracting the mean
and dividing the result by the standard deviation).
Ian Kaplan
October 2013
Last revised: February 2014
Back to topics in Quantitative Finance
